![]()
Databricks Databricks-Certified-Professional-Data-Scientist Exam Info and Free Practice Test | Exam-Killer
Pass Databricks Databricks-Certified-Professional-Data-Scientist Premium Files Test Engine pdf - Free Dumps Collection
Databricks Databricks-Certified-Professional-Data-Scientist Exam Syllabus Topics:
| Topic | Details |
|---|---|
| Topic 1 |
|
| Topic 2 |
|
| Topic 3 |
|
| Topic 4 |
|
| Topic 5 |
|
| Topic 6 |
|
| Topic 7 |
|
NEW QUESTION 70
As a data scientist consultant at ABC Corp, you are working on a recommendation engine for the learning resources for end user. So Which recommender system technique benefits most from additional user preference data?
- A. Naive Bayes classifier
- B. Item-based collaborative filtering
- C. Logistic Regression
- D. Content-based filtering
Answer: B
Explanation:
Explanation
Item-based scales with the number of items, and user-based scales with the number of users you have. If you have something like a store, you'll have a few thousand items at the most. The biggest stores at the time of writing have around 100,000 items. In the Netflix competition, there were 480,000 users and 17,700 movies. If you have a lot of users: then you'll probably want to go with item-based similarity. For most product-driven recommendation engines, the number of users outnumbers the number of items. There are more people buying items than unique items for sale. Item-based collaborative filtering makes predictions based on users preferences for items. More preference data should be beneficial to this type of algorithm. Content-based filtering recommender systems use information about items or users, and not user preferences, to make recommendations. Logistic Regression, Power iteration and a Naive Bayes classifier are not recommender system techniques.
NEW QUESTION 71
A problem statement is given as below
Hospital records show that of patients suffering from a certain disease, 75% die of it. What is the probability that of 6 randomly selected patients, 4 will recover?
Which of the following model will you use to solve it.
- A. Normal
- B. Binomial
- C. Any of the above
- D. Poisson
Answer: B
NEW QUESTION 72
What is one modeling or descriptive statistical function in MADlib that is typically not provided in a standard relational database?
- A. Linear regression
- B. Variance
- C. Quantiles
- D. Expected value
Answer: A
NEW QUESTION 73
Assume some output variable "y" is a linear combination of some independent input variables "A" plus some independent noise "e". The way the independent variables are combined is defined by a parameter vector B y=AB+e where X is an m x n matrix. B is a vector of n unknowns, and b is a vector of m values. Assuming that m is not equal to n and the columns of X are linearly independent, which expression correctly solves for B?
- A. Option A
- B. Option C
- C. Option B
- D. Option D
Answer: D
Explanation:
Explanation
This is the standard solution of the normal equations for linear regression. Because A is not square, you cannot simply take its inverse.
NEW QUESTION 74
Select the correct statement regarding the naive Bayes classification
- A. only the variances of the variables for each class need to be determined
- B. for each class entire covariance matrix need to be determined
- C. Independent variables can be assumed
- D. it only requires a small amount of training data to estimate the parameters
Answer: A,C,D
Explanation:
Explanation
An advantage of naive Bayes is that it only requires a small amount of training data to estimate the parameters (means and variances of the variables) necessary for classification. Because independent variables are assumed, only the variances of the variables for each class need to be determined and not the entire covariance matrix.
NEW QUESTION 75
A website is opened 3 times by a user. What is the probability of he clicks 2 times the advertisement, is best calculated by
- A. Normal
- B. Binomial
- C. Any of the above
- D. Poisson
Answer: B
Explanation:
Explanation
In a binomial distribution, only 2 parameters, namely n and p, are needed to determine the probability. Where p is the probability of success and q is the probability of failure in a binomial trial, then the expected number of successes in n trials.
This is a binomial distribution because there are only 2 possible outcomes (we get a 5 or we don't).
NEW QUESTION 76
Refer to exhibit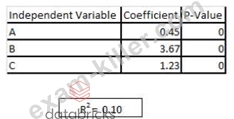
You are asked to write a report on how specific variables impact your client's sales using a data set provided to you by the client. The data includes 15 variables that the client views as directly related to sales, and you are restricted to these variables only. After a preliminary analysis of the data, the following findings were made: 1.
Multicollinearity is not an issue among the variables 2. Only three variables-A, B, and C-have significant correlation with sales You build a linear regression model on the dependent variable of sales with the independent variables of A, B, and C.
The results of the regression are seen in the exhibit. You cannot request additional data. what is a way that you could try to increase the R2 of the model without artificially inflating it?
- A. Force all 15 variables into the model as independent variables
- B. Create clusters based on the data and use them as model inputs
- C. Create interaction variables based only on variables A, B, and C
- D. Break variables A, B, and C into their own univariate models
Answer: B
Explanation:
Explanation
In statistics, linear regression is an approach for modeling the relationship between a scalar dependent variable y and one or more explanatory variables (or independent variable) denoted X.
The case of one explanatory variable is called simple linear regression. For more than one explanatory variable, the process is called multiple linear regression. (This term should be distinguished from multivariate linear regression^ where multiple correlated dependent variables are predicted, rather than a single scalar variable.) In linear regression data are modeled using linear predictor functions, and unknown model parameters are estimated from the data.
Such models are called linear models. Most commonly, linear regression refers to a model in which the conditional mean of y given the value of X is an affine function of X.
Less commonly: linear regression could refer to a model in which the median, or some other quantile of the conditional distribution of y given X is expressed as a linear function of X.
Like all forms of regression analysis, linear regression focuses on the conditional probability distribution of y given X, rather than on the joint probability distribution of y and X:
which is the domain of multivariate analysis.
NEW QUESTION 77
Suppose there are three events then which formula must always be equal to P(E1|E2,E3)?
- A. P(E1,E2,E3)P(E1)/P(E2:E3)
- B. P(E1,E2;E3)/P(E2,E3)
- C. P(E1,E2|E3)P(E2|E3)P(E3)
- D. P(E1,E2|E3)P(E3)
- E. P(E1,E2,E3)P(E2)P(E3)
Answer: B
Explanation:
Explanation
This is an application of conditional probability: P(E1,E2)=P(E1|E2)P(E2). so P(E1|E2) = P(E1.E2)/P(E2) P(E1,E2,E3)/P(E2,E3) If the events are A and B respectively, this is said to be "the probability of A given B" It is commonly denoted by P(A|B): or sometimes PB(A). In case that both "A" and "B" are categorical variables, conditional probability table is typically used to represent the conditional probability.
NEW QUESTION 78
Suppose that we are interested in the factors that influence whether a political candidate wins an election. The outcome (response) variable is binary (0/1); win or lose. The predictor variables of interest are the amount of money spent on the campaign, the amount of time spent campaigning negatively and whether or not the candidate is an incumbent.
Above is an example of
- A. Linear Regression
- B. Maximum likelihood estimation
- C. Logistic Regression
- D. Hierarchical linear models
- E. Recommendation system
Answer: C
Explanation:
Explanation : Logistic regression
Pros: Computationally inexpensive, easy to implement, knowledge representation easy to interpret Cons: Prone to underfitting, may have low accuracy Works with: Numeric values, nominal values
NEW QUESTION 79
What is the best way to evaluate the quality of the model found by an unsupervised algorithm like k-means clustering, given metrics for the cost of the clustering (how well it fits the data) and its stability (how similar the clusters are across multiple runs over the same data)?
- A. The lowest cost clustering
- B. The lowest cost clustering subject to a stability constraint
- C. The most stable clustering subject to a minimal cost constraint
- D. The most stable clustering
Answer: B
Explanation:
Explanation
There is a tradeoff between cost and stability in unsupervised learning. The more tightly you fit the data, the less stable the model will be, and vice versa. The idea is to find a good balance with more weight given to the cost. Typically a good approach is to set a stability threshold and select the model that achieves the lowest cost above the stability threshold.
NEW QUESTION 80
A fruit may be considered to be an apple if it is red, round, and about 3" in diameter. A naive Bayes classifier considers each of these features to contribute independently to the probability that this fruit is an apple, regardless of the
- A. None of the above
- B. Presence or absence of the other features
- C. Presence of the other features.
- D. Absence of the other features.
Answer: B
Explanation:
Explanation
In simple terms, a naive Bayes classifier assumes that the value of a particular feature is unrelated to the presence or absence of any other feature, given the class variable. For example, a fruit may be considered to be an apple if it is red, round, and about 3" in diameter A naive Bayes classifier considers each of these features to contribute independently to the probability that this fruit is an apple, regardless of the presence or absence of the other features.
NEW QUESTION 81
Which of the following are advantages of the Support Vector machines?
- A. Effective in cases where number of dimensions is greater than the number of samples
- B. Number of features is much greater than the number of samples, the method still give good performances
- C. SVMs directly provide probability estimates
- D. Effective in high dimensional spaces.
- E. possible to specify custom kernels
- F. it is memory efficient
Answer: A,D,E,F
Explanation:
Explanation
Support vector machines (SVMs) are a set of supervised learning methods used for classification, regression and outliers detection.
The advantages of support vector machines are:
Effective in high dimensional spaces.
Still effective in cases where number of dimensions is greater than the number of samples.
Uses a subset of training points in the decision function (called support vectors), so it is also memory efficient.
Versatile: different Kernel functions can be specified for the decision function.
Common kernels are provided, but it is also possible to specify custom kernels.
The disadvantages of support vector machines include:
If the number of features is much greater than the number of samples, the method is likely to give poor performances.
SVMs do not directly provide probability estimates, these are calculated using an expensive five-fold cross-validation.
NEW QUESTION 82
Refer to the exhibit.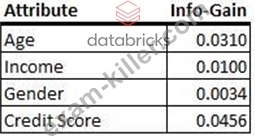
You are building a decision tree. In this exhibit, four variables are listed with their respective values of info-gain.
Based on this information, on which attribute would you expect the next split to be in the decision tree?
- A. Age
- B. Gender
- C. Credit Score
- D. Income
Answer: C
NEW QUESTION 83
Spam filtering of the emails is an example of
- A. Supervised learning
- B. 1 and 3 are correct
- C. Unsupervised learning
- D. Clustering
- E. 2 and 3 are correct
Answer: A
Explanation:
Explanation
Clustering is an example of unsupervised learning. The clustering algorithm finds groups within the data without being told what to look for upfront. This contrasts with classification, an example of supervised machine learning, which is the process of determining to which class an observation belongs. A common application of classification is spam filtering. With spam filtering we use labeled data to train the classifier:
e-mails marked as spam or ham.
NEW QUESTION 84
Which of the following statement is true for the R square value in the regression model?
- A. R-squared never decreases upon adding more independent variables.
- B. When R square =0, all the residual are equal to 1
- C. When R square =1 , all the residuals are equal to 0
- D. R square can be increased by adding more variables to the model.
Answer: A,C,D
NEW QUESTION 85
Question-18. What is the best way to ensure that the k-means algorithm will find a good clustering of a collection of vectors?
- A. Choose the initial centroids so that they are far away from each other
- B. Run at least log(N) iterations of Lloyd's algorithm, where N is the number of observations in the data set
- C. Choose the initial centroids so that they all He along different axes
- D. Only consider values of k larger than log(N), where N is the number of observations in the data set
Answer: A
Explanation:
Explanation
k-means clustering is a method of vector quantization, originally from signal processing, that is popular for cluster analysis in data mining, k-means clustering aims to partition n observations into k clusters in which each observation belongs to the cluster with the nearest mean, serving as a prototype of the cluster. This results in a partitioning of the data space into Voronoi cells.
The problem is computationally difficult (NP-hard); however there are efficient heuristic algorithms that are commonly employed and converge quickly to a local optimum. These are usually similar to the expectation-maximization algorithm for mixtures of Gaussian distributions via an iterative refinement approach employed by both algorithms. Additionally, they both use cluster centers to model the data; however k-means clustering tends to find clusters of comparable spatial extent, while the expectation-maximization mechanism allows clusters to have different shapes This Question-is about the properties that make k-means an effective clustering heuristic which primarily deal with ensuring that the initial centers are far away from each other. This is how modern k-means algorithms like k-means++ guarantee that with high probability Lloyd's algorithm will find a clustering within a constant factor of the optimal possible clustering for each k.
NEW QUESTION 86
Which of the following is a Continuous Probability Distributions?
- A. Negative binomial distribution
- B. Poisson probability distribution
- C. Normal probability distribution
- D. Binomial probability distribution
Answer: C
NEW QUESTION 87
You are working on a Data Science project and during the project you have been gibe a responsibility to interview all the stakeholders in the project. In which phase of the project you are?
- A. Creating Models
- B. Discovery
- C. Operationnalise the models
- D. Executing Models
- E. Creating visuals from the outcome
- F. Data Preparations
Answer: B
Explanation:
Explanation
During the discovery phase you will be interviewing all the project stakeholders because they would be having quite a good amount of knowledge for the problem domain you will be working and you also interviewing project sponsors you will get to know what all are the expectations once project get completed. Hence, you will be noting down all the expectations from the project as well as you will be using their expertise in the domain.
NEW QUESTION 88
......
Updated Official licence for Databricks-Certified-Professional-Data-Scientist Certified by Databricks-Certified-Professional-Data-Scientist Dumps PDF: https://www.exam-killer.com/Databricks-Certified-Professional-Data-Scientist-valid-questions.html